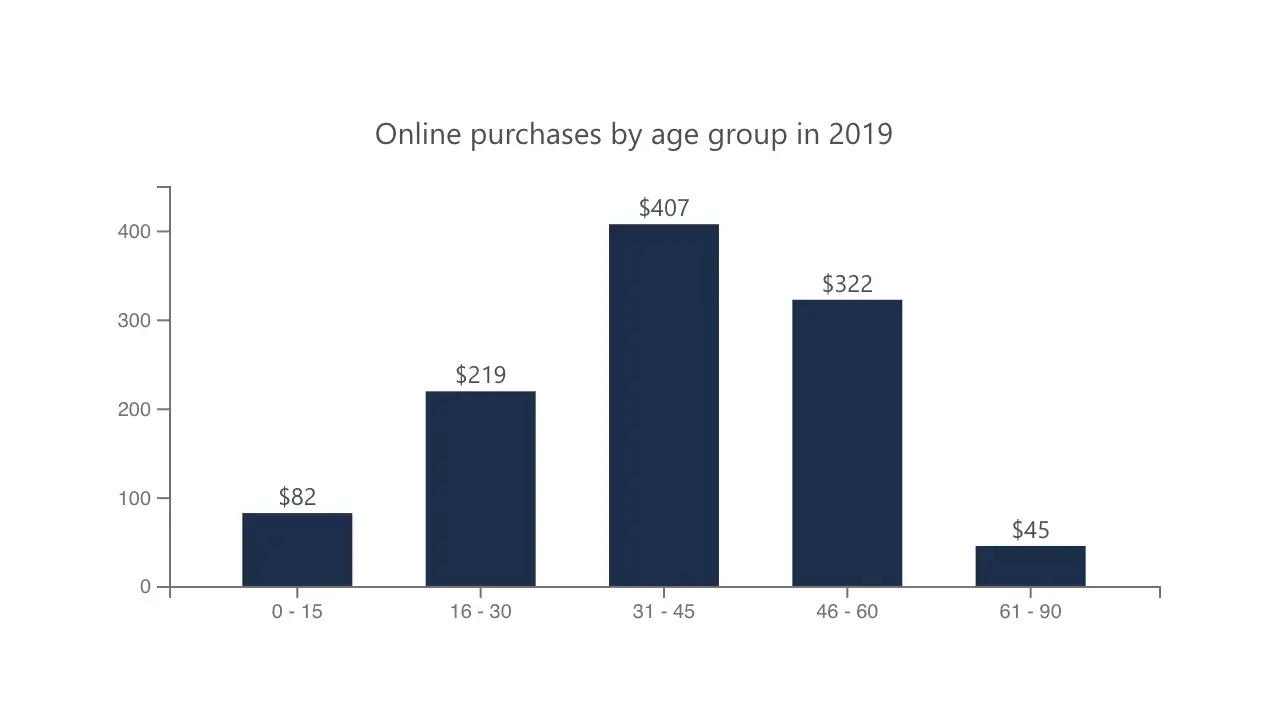
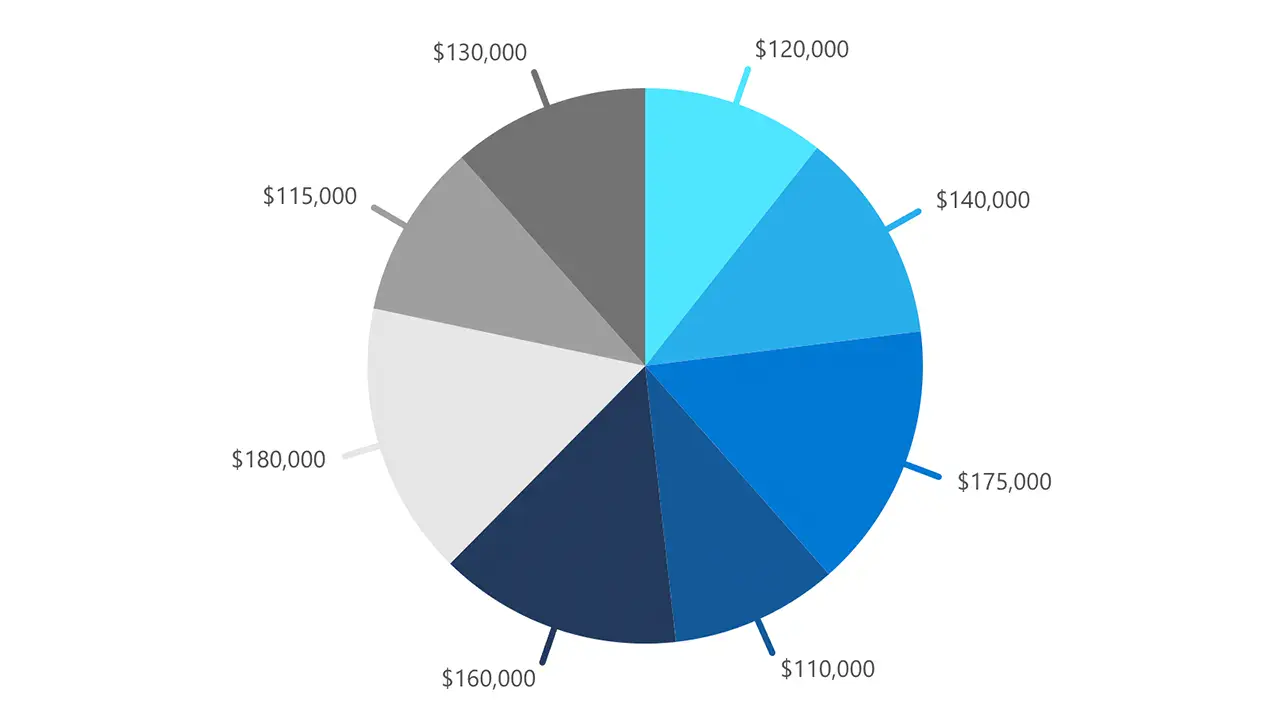
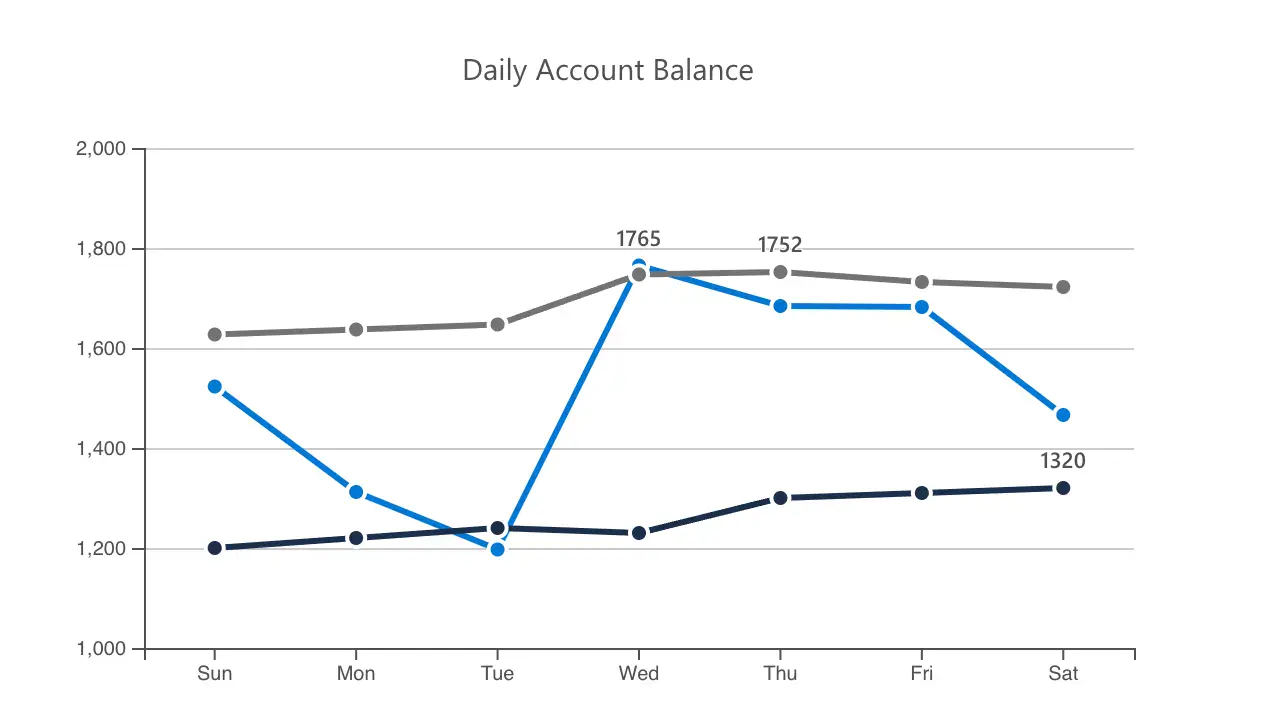
Microsoft Advertising Data Charts
As part of a request to remove the need for Power BI on the Microsoft Advertising website, I developed a series of JavaScript components that could generate the types of infographic content that was used in articles on the site.
After reviewing several existing infographic libraries, D3.js was chosen for its flexibility. Many existing libraries were not fully accessible and were over-built, including features not used by content creators. Using D3.js allowed us to customize infographics to suit the needs of Microsoft Advertising content.
The final JavaScript components included JSON data provided by the Kentico CMS system. I worked closely with the development team to integrate the components into the CMS, providing documentation, JavaScript, HTML markup, and prototypes examples of the components.
A key requirement for the components was to be fully accessible. Developing the components required extensive testing with screen readers and modifying the JavaScript to ensure that all users can access and understand the data. This includes paying special attention to color contrast and screen reader support.
After handing off the final JavaScript to the development team, I created documentation and training for the content publishing team so that they could easily implement data visualizations on the site.


